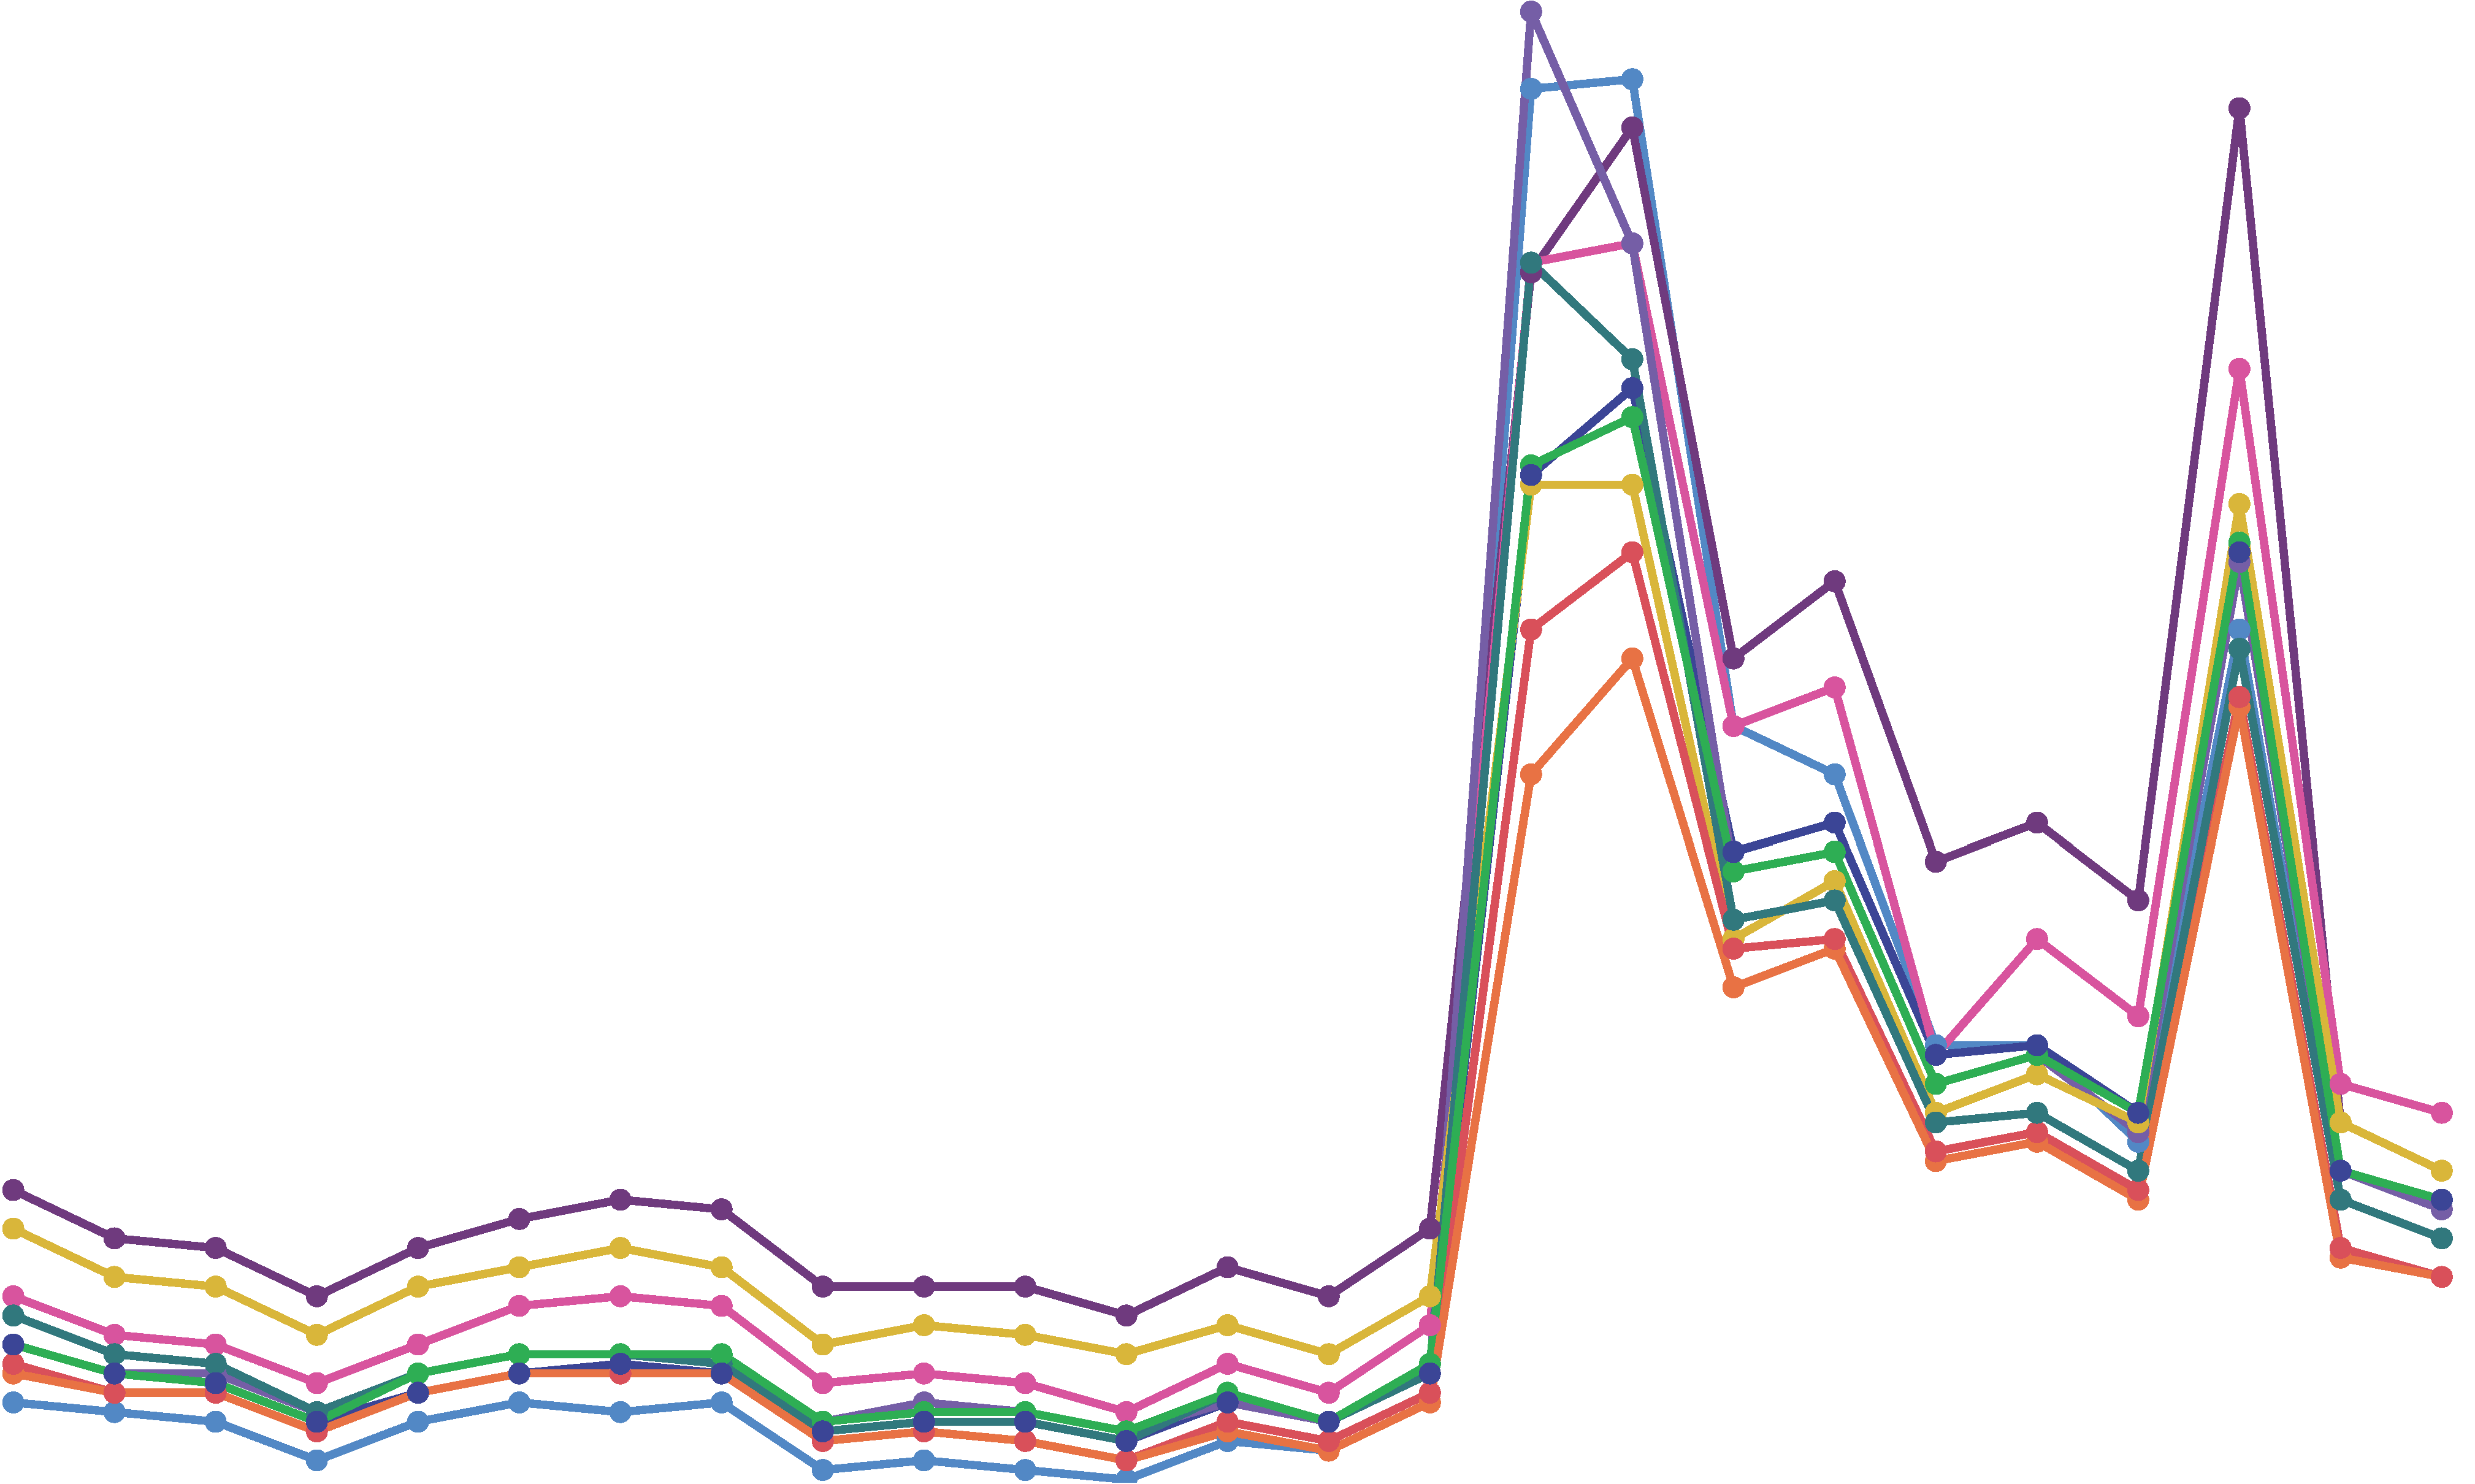
We like to see data. Reading data just doesn’t paint the same picture as data visualization. With a keen focus on the unemployment rate over the last 15 months, we wanted to see what was happening across our primary market (NC, SC, and VA). Like you, over the past 15 months we read about soaring unemployment, recovery, higher unemployment again, recovery, and now, lingering unemployment. We gathered unemployment rates for the top 10 largest MSAs in NC, SC, and VA (SC only has nine MSAs) from 2019-present and plotted the data. It paints an interesting, colorful picture of one aspect of the pandemic.
2019 is a group of almost flat lines showing low unemployment rates all year. At the end of 2019, unemployment rates across MSAs in NC, SC, and VA were below what most economists consider full employment. The lowest annual MSA unemployment rate in the three states was 2.3% in Charleston and the highest was 4.9% in Fayetteville. Charleston had reached a remarkably low rate of 1.5% in September of 2019. In fact, Charleston stayed below 2% for three straight months. Four other South Carolina MSAs fell below 2% in 2019. Only two MSAs in Virginia dipped below 2% in 2019.
The colorful lines show the dramatic changes in unemployment rates in April 2020. The average unemployment of the largest MSAs in each state in 2019 was 3.8% in North Carolina, 2.9% in South Carolina, and 2.% in Virginia. The economy was moving full steam ahead and unemployment was staying well below full employment. By the end of 2020, the annual averages of the MSAs had increased to North Carolina 7.5%, South Carolina 6.3%, and Virginia 5.9%. Within these annual figures are stories of extreme shifts in unemployment that are easier to see when the data is presented in colorful lines.
North Carolina
The Asheville MSA had the widest swings in unemployment. At the end of 2019, the Asheville MSA had the lowest annual unemployment rate of the 10 largest metros at 3.1%. By April 2020, it had the second highest at 17%. By the end of 2020, the December rate in Asheville had declined to 5.6%, one of the lowest in the group. Other MSAs with wide swings were Hickory-Lenoir-Morganton, Wilmington, and Greensboro. Asheville and Wilmington have a large tourism economy which likely fueled the wide swings. Durham has the lowest unemployment rate today at 3.8%, back to below full employment.
South Carolina
It is no surprise that the widest swing in unemployment rates in South Carolina MSAs was in the Myrtle Beach MSA. The rate went from a 4% annual rate in 2019 to 19.6% in April 2020 to 7.7% at the end of 2020 in December. Spartanburg had the second lowest unemployment rate in 2019 at 2.5%. It reached 13.7% in April 2020 before falling to 5.9% at the end of the year. Other large swings in unemployment were found in the Greenville and Charleston MSAs. The lowest MSA unemployment rate is today is 4.1% in both Greenville and Augusta-Richmond.
Virginia
Virginia Beach MSA had one of the higher, if you can call 3% high, unemployment rates in the commonwealth in 2019. The rate soared to 12.4% in April 2020 before falling to 6.5% by December. The tourism economy of Virginia Beach explains a lot of the swing. Blacksburg, Richmond, and Roanoke all saw significant swings in unemployment. Winchester MSA currently has the lowest unemployment rate in the state at 4%.
These colorful lines show the wild ride the economy has been on the last fifteen months. It is clear which MSAs had low rates pre-pandemic, which ones suffered the most, and which rebounded the fastest. It’s easy to track Durham’s orange line and compare it to Asheville’s bright blue line. Visualizing the data makes it easier to grasp than a table of data points. The next time you need to present data to your board or elected leaders, think about how the data can be presented in a colorful visual. The saying that a picture is worth a thousand words was never more true than when conveying data.